Comparison of common methods for measuring alcohol in wine
One of the most commonly measured and heavily regulated aspects of wine production and sale is its alcoholic content, usually expressed in terms of percent alcohol volume per volume (% alcohol by volume, % v/v). In typical table wines this alcohol content is made up mostly of ethanol, with minor contributions from other higher alcohols and a very small amount of methanol. These other alcohols generally contribute around 0.2% of the overall measured alcohol by volume, but this may vary significantly from wine to wine. A range of different methods for measuring alcohol are used across the global wine industry – ranging from ‘traditional’ distillation-based methods to more recent instrument-based techniques. Understanding the differences in precision and accuracy of these methods is important because wine is traded and sold across different international jurisdictions, which may have different tolerances.
Investigating the variation in results across industry laboratories
While suppliers or published methods often provide information on the expected accuracy and precision of analytical methods, these are often determined in individual laboratories under ideal conditions. They therefore do not represent well the average level of variation seen across a range of industry facilities. To better understand the ‘real-world’ variation, the authors looked at two years of results from the Interwinery Analysis Group (IWAG) program, an internationally accredited proficiency testing program for wine-producing and testing facilities, which has more than 200 Australian and international member laboratories. The data included 12 rounds of testing, with each laboratory testing two samples of the same wine in each round. On average, 162 facilities submitted results in each testing round. Obvious outliers were removed, as were methods used by only two to three laboratories, leaving 3,838 submitted values. Each round of testing was then normalised to an average alcohol value of 12.5% v/v and the combined results were used to compare the different methods.
Which methods are used across the wine industry?
Figure 1 shows the different methods represented in the data, indicating which are in regular use in wine testing laboratories and the proportion to which they are used.
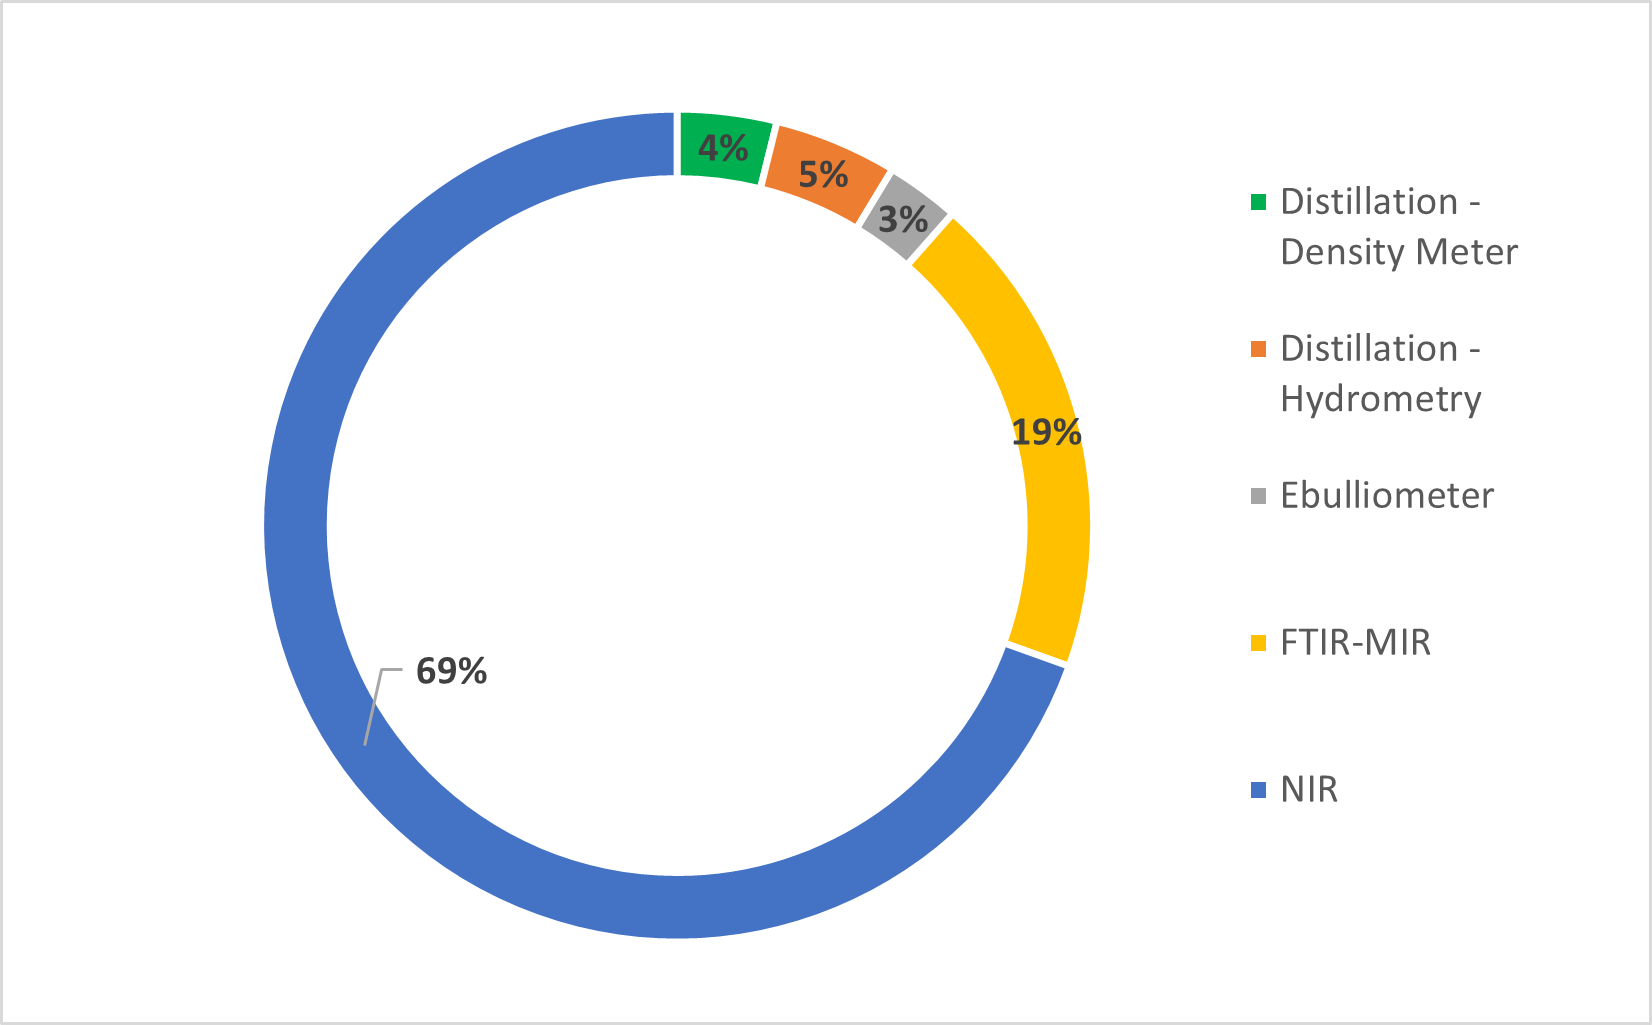
Figure 1. The relative frequency of the different methods for analysing alcohol seen in the IWAG data (NIR – near infrared, FTIR-MIR – Fourier Transform infrared-mid-infrared).
It is clear that near infrared (NIR) instruments are the most common, with 69% of the laboratories in the dataset using this technology. This is not surprising as over the last two decades NIR instruments have proven to be a relatively cost effective and easy way of determining alcohol in wine and other beverages, replacing many more traditional methodologies. The next most common method is mid-infrared technology (FTIR-MIR) (19% of submitted results). This technology is typically more expensive than NIR (although some current instruments are equivalent in price) but has the advantage of being able to also provide results for other wine analytes with appropriate calibrations. The calibration of such instruments is, however, more involved and needs to be constantly monitored. Distillation followed by density determination either using hydrometry (5%) or density meter (4%) are the next most common techniques with only 3% of submitted results being from ebulliometry. While all three of these methods use equipment which is much cheaper than the previous two methods, they are in general more labour and time intensive, which is probably why many facilities have instead adopted instrument-based techniques. A small number of results were submitted from gas chromatography and pycnometer methods; however, there were too few to make any meaningful comparisons.
Analytical methods compared
The spread of results for each of the alcohol analysis methods is shown in Figure 2 and tabulated in Table 1.
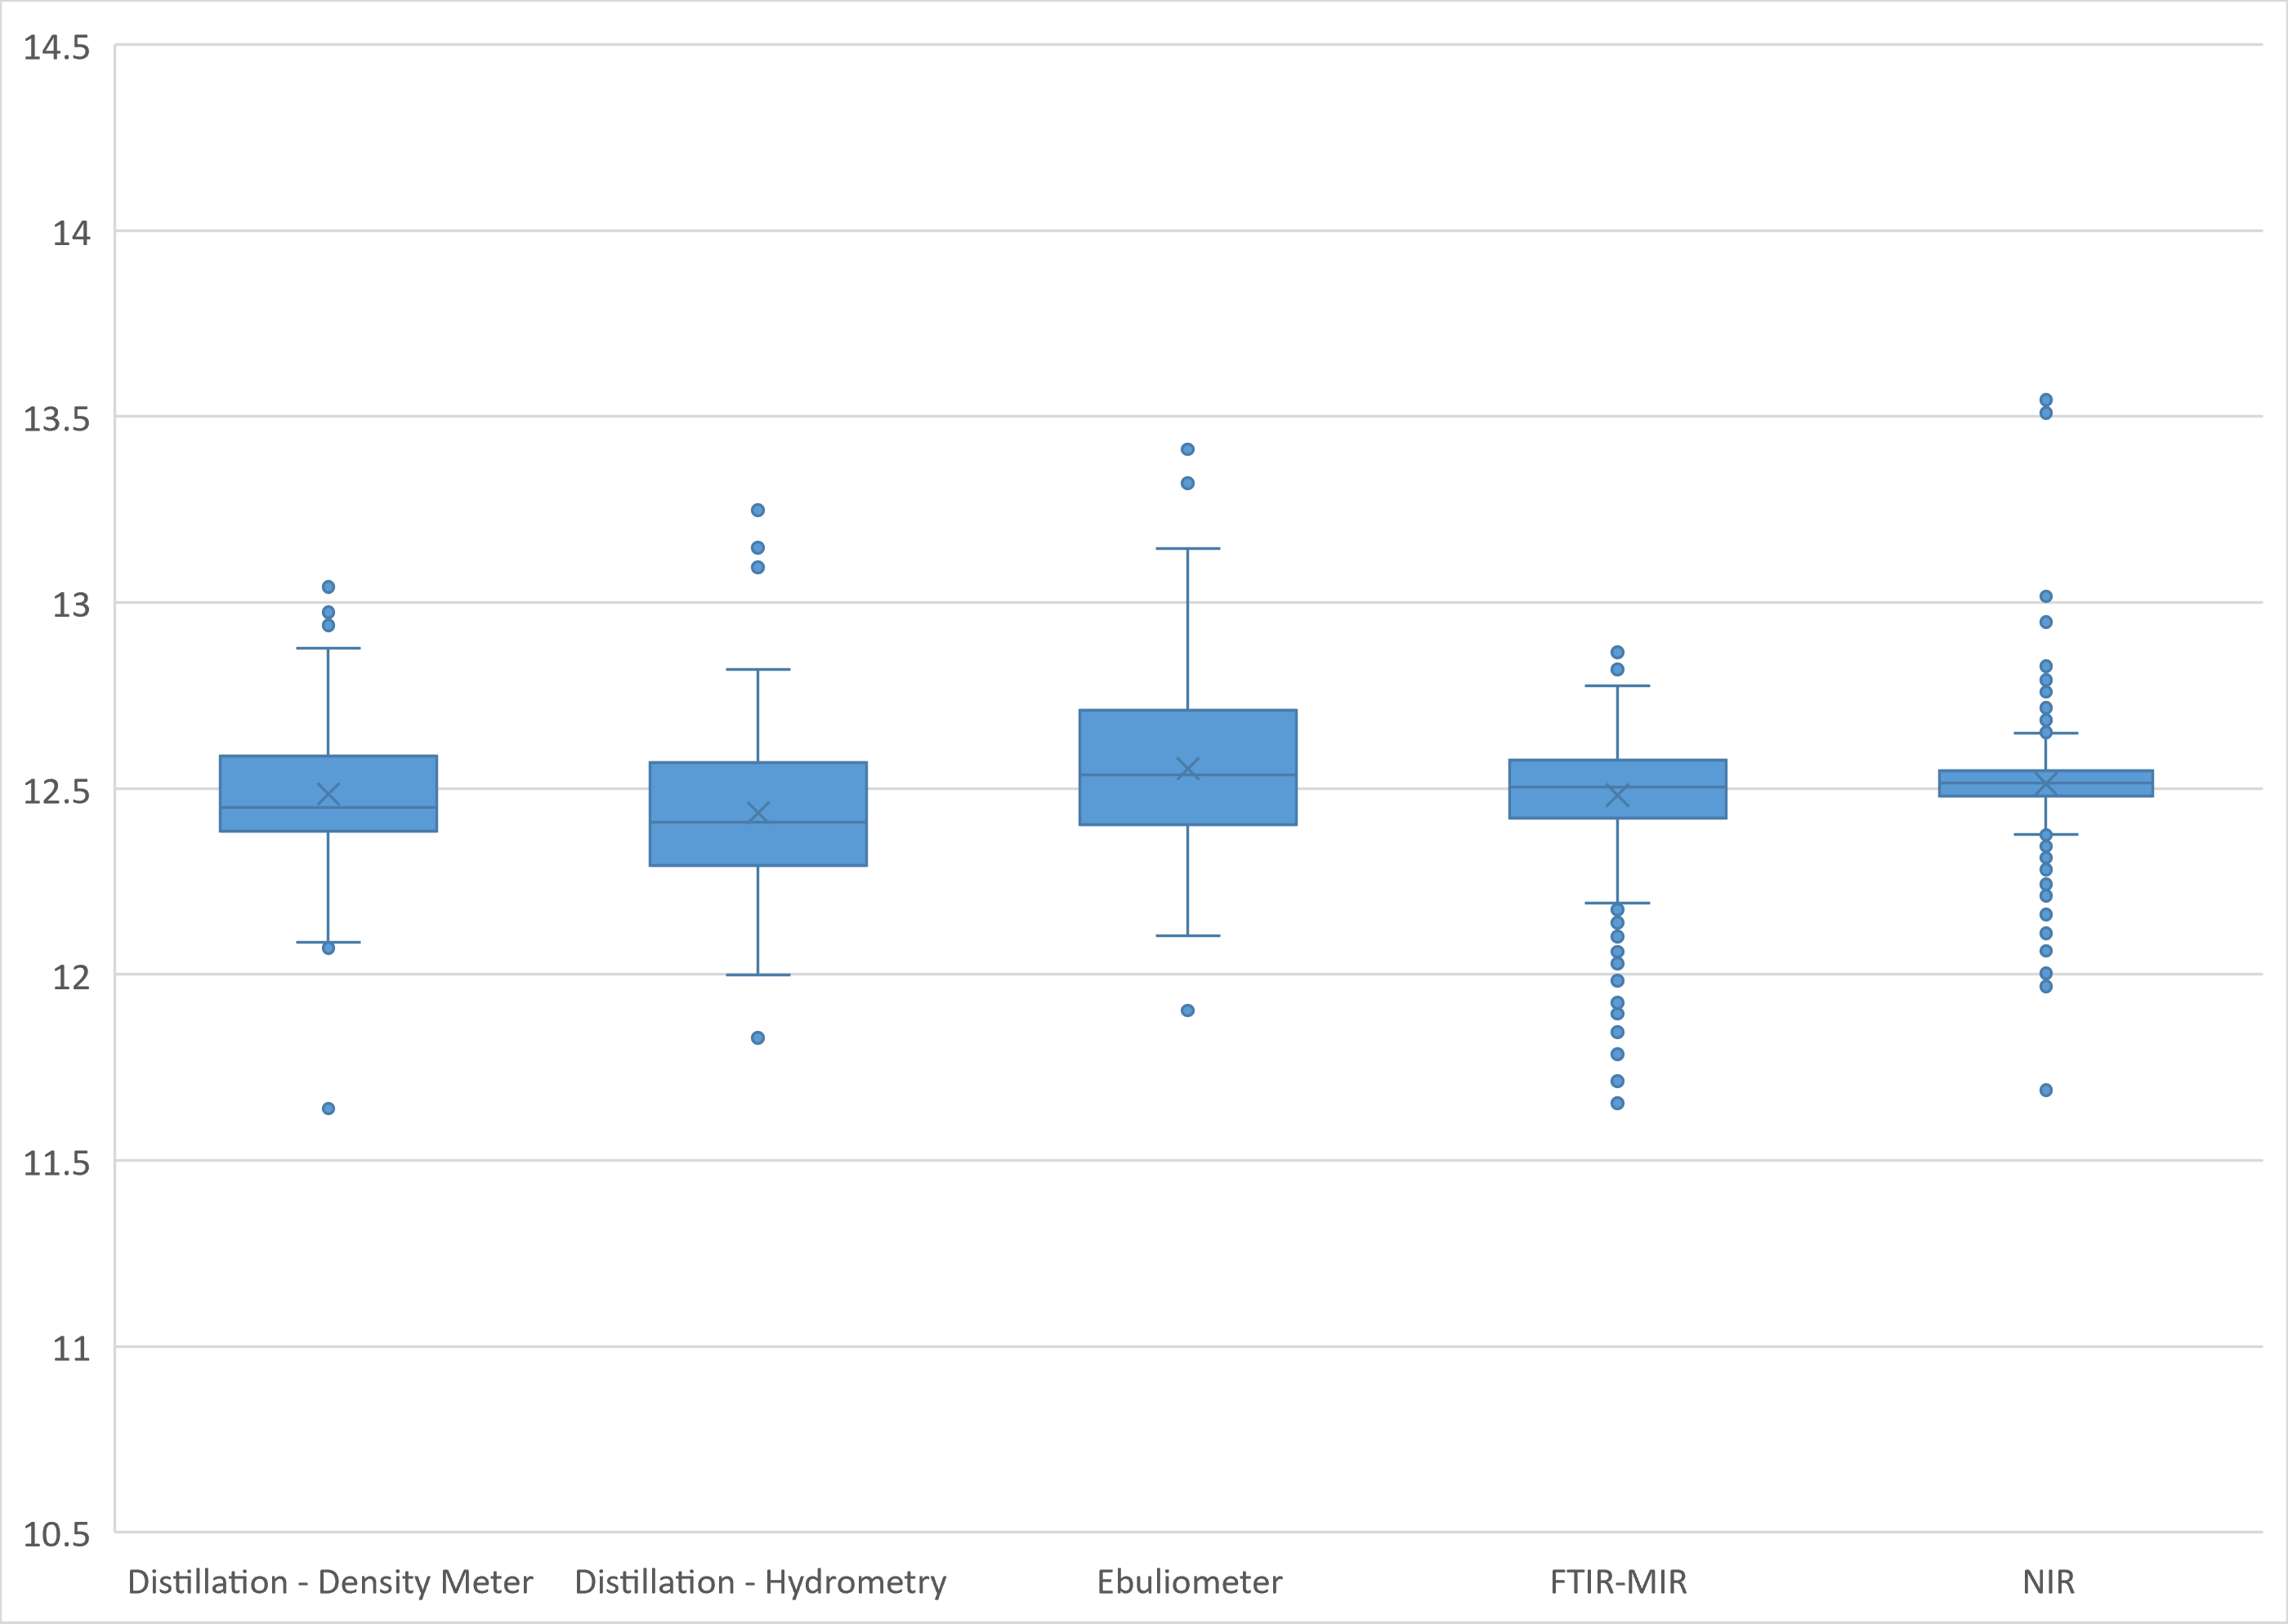
Figure 2. The relative spread of results from five different analytical methods for alcohol in wine, as measured by laboratories in the Interwinery Analysis Group, with each round of testing normalised to an average value of 12.5% (v/v). The boxes represent the spread from the first quartile to the third quartile of the data, with the horizontal line within the box representing the median value. The ‘whisker’ lines above and/or below each box extend as far as the minimum and maximum values measured, excluding outliers (which are shown as blue circles).
Table 1. Summary statistics describing the distribution of results for each alcohol analysis method. Results from each testing round were normalised to an average value of 12.5% (v/v) and then aggregated into a single data set. All values are alcohol % v/v.
| Analysis method | Mean | n | Standard deviation | Minimum value | Q1 | Median | Q3 | Maximum value | Interquartile range |
| Distillation – Density Meter | 12.49 | 148 | 0.22 | 11.64 | 12.39 | 12.45 | 12.59 | 13.06 | 0.20 |
| Distillation – Hydrometry | 12.43 | 184 | 0.21 | 11.83 | 12.29 | 12.41 | 12.57 | 13.25 | 0.28 |
| Ebulliometer | 12.55 | 110 | 0.26 | 11.90 | 12.40 | 12.54 | 12.71 | 13.41 | 0.31 |
| FTIR-MIR | 12.48 | 728 | 0.15 | 11.65 | 12.42 | 12.50 | 12.58 | 12.90 | 0.16 |
| NIR | 12.51 | 2,668 | 0.08 | 11.69 | 12.48 | 12.51 | 12.55 | 13.55 | 0.07 |
It is evident that the NIR results show a much narrower distribution than the other methods, with an interquartile range of 0.07% v/v and a standard deviation of 0.08 % v/v, half that of the next best performing method. In other words, more than 95% of the NIR results were within 0.16 % v/v of the mean result. The results defined as outliers (the circles above and below the horizontal lines) represent fewer than 1% of submitted results and are evenly distributed either side of the mean. The data is also centred on the normalised mean, demonstrating no real bias from the analytical method and suggesting the outliers are likely the result of poor calibration of individual instruments.
The next best performing method was FTIR-MIR, which had a standard deviation 0.15% v/v and an interquartile range of 0.16% v/v. The mean and median (12.48% and 12.50% v/v respectively) results were relatively close to the normalised value; however, the outliers were significantly weighted towards low results, perhaps demonstrating the greater difficulties often encountered with calibration of this kind of technology.
The other three methods showed a significantly larger distribution of results than NIR or FTIR-MIR, all with standard deviations between 0.21% and 0.26% alcohol v/v, suggesting 95% of results were within +/- 0.4 to 0.5% v/v of the mean value. Both distillation-based techniques showed a negative bias of the median compared to the normalised mean, which may reflect ethanol losses occurring during the distillation step of the analysis. Ebulliometry, on the other hand, showed a slightly positively biased result. Overall ebulliometry had the largest distribution of results, although its interquartile range was comparable to that of distillation-hydrometry.
Conclusion – instrument-based methods give most consistent results
This dataset clearly shows that the modern instrument-based techniques such as NIR and FTIR-MIR give more consistent results for alcohol analysis of wines than more traditional methods. Given that these are the methods used by nearly 90% of laboratories included in this study, it would be reasonable to expect individual facilities to be able to achieve results within +/- 0.3% of the consensus mean. This would represent a realistic industry reference, be an achievable performance target for industry laboratories and fall within the requirements of most domestic and international labelling requirements.
When reviewing collated analytical results of this type it’s important to note that they reflect the overall performance of the participating facilities. Any individual facility may perform significantly better even when using techniques which, when viewed for the whole, perform more poorly, depending on the skills and procedures involved.
Eric Wilkes, General Manager – Affinity Labs, eric.wilkes@affinitylabs.com.au
Robert Pride, Chair, Interwinery Analysis Group
Acknowledgements
The data for this study was kindly provided by the Interwinery Analysis Group. The AWRI’s communications are supported by Australia’s grapegrowers and winemakers through their investment body, Wine Australia, with matching funding from the Australian Government.
Note
This article by Eric Wilkes and Robert Pride was first published in AWRI Technical Review No. 257 in April 2022.